Highlights 2014
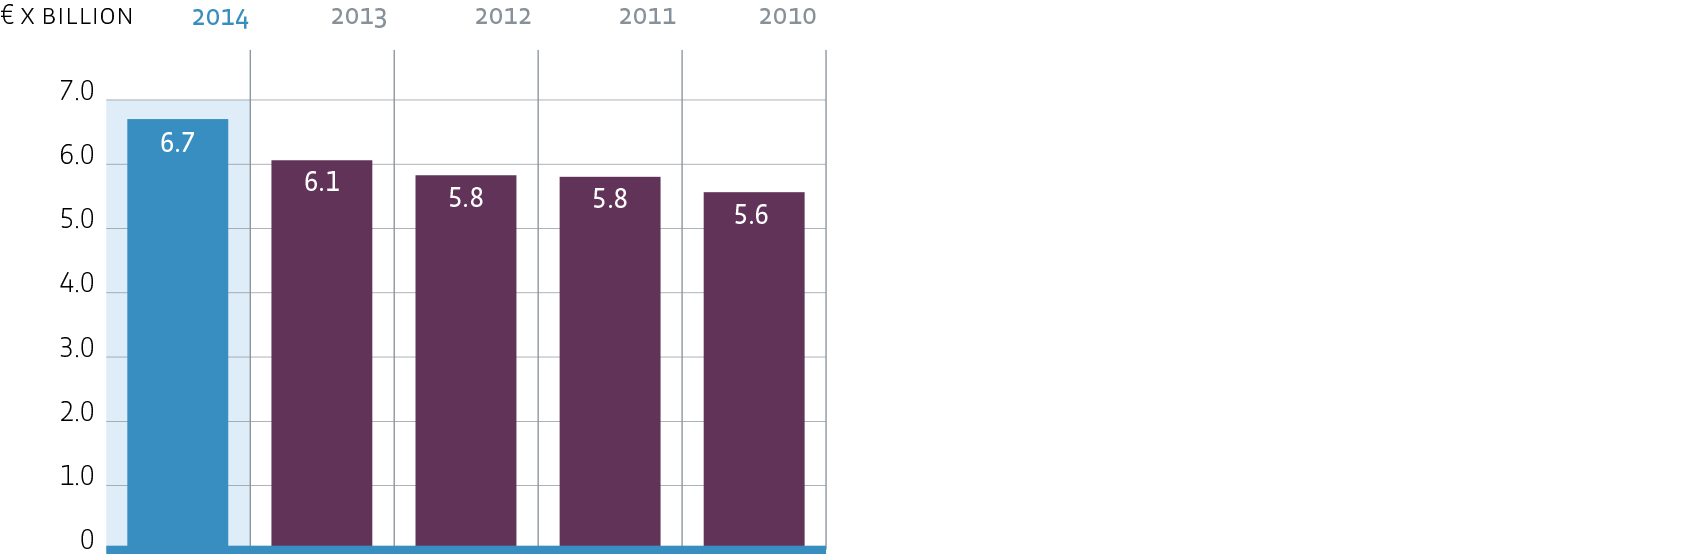
- Growth of assets under management to € 6.7 billion (10%)
- Return on assets under management 6.5% (excl. forex) and 8.8% (incl. forex)
- Record investments of over € 600 million in the Dutch portfolio and more than € 500 in international unlisted and listed funds
- First two acquisitions for Healthcare Fund
- New investors in the Residential Fund
- Management fee (0.5%) of Dutch investments below benchmark
- AIFMD license acquired as per 17 February 2014
- GRESB Green Star rating for our three Dutch sector funds
- Two new Supervisory Board members
- New Managing Director Finance as per 1 October 2014
- Growth of FTEs to 128.0 (4.4%)
- Low rate of absenteeism (2.35%)
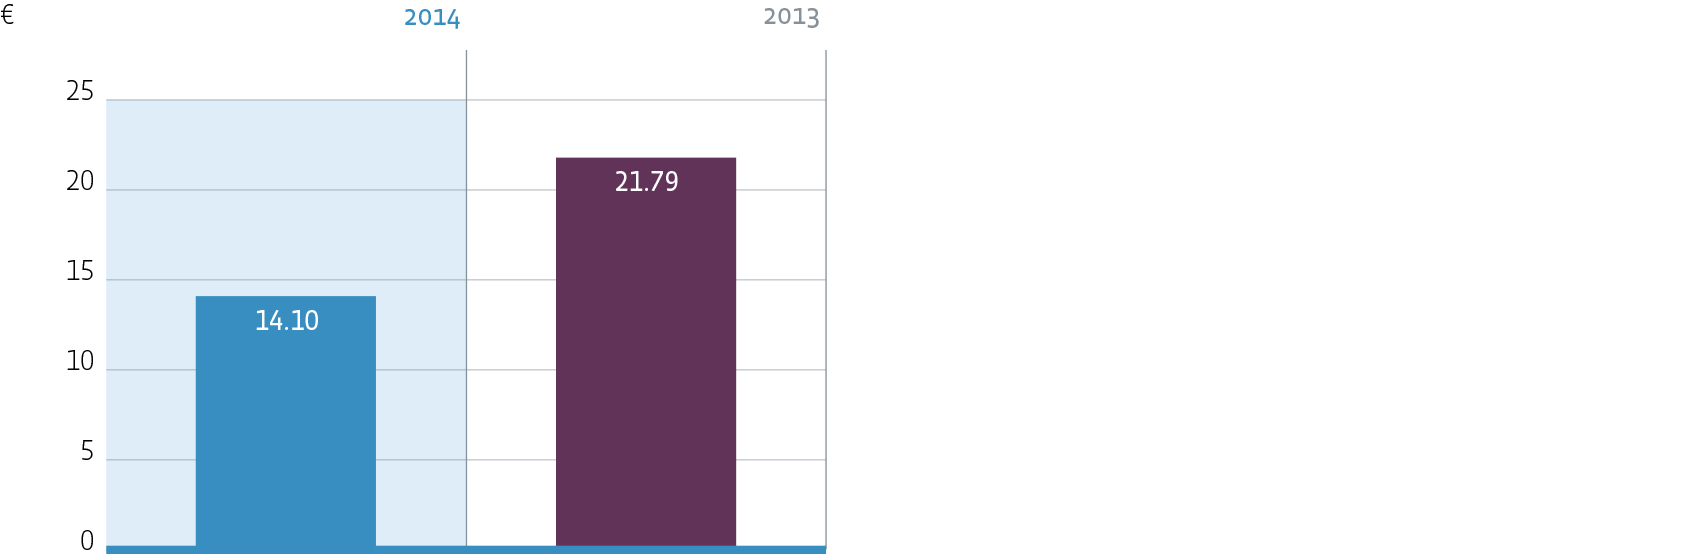
Performance per share
| | 2014 | 2013 |
| Net earnings (in €) | 14.10 | 21.79 |
| Net asset value (in € at year-end) | 120.83 | 106.72 |
Download XLSNet earnings per share
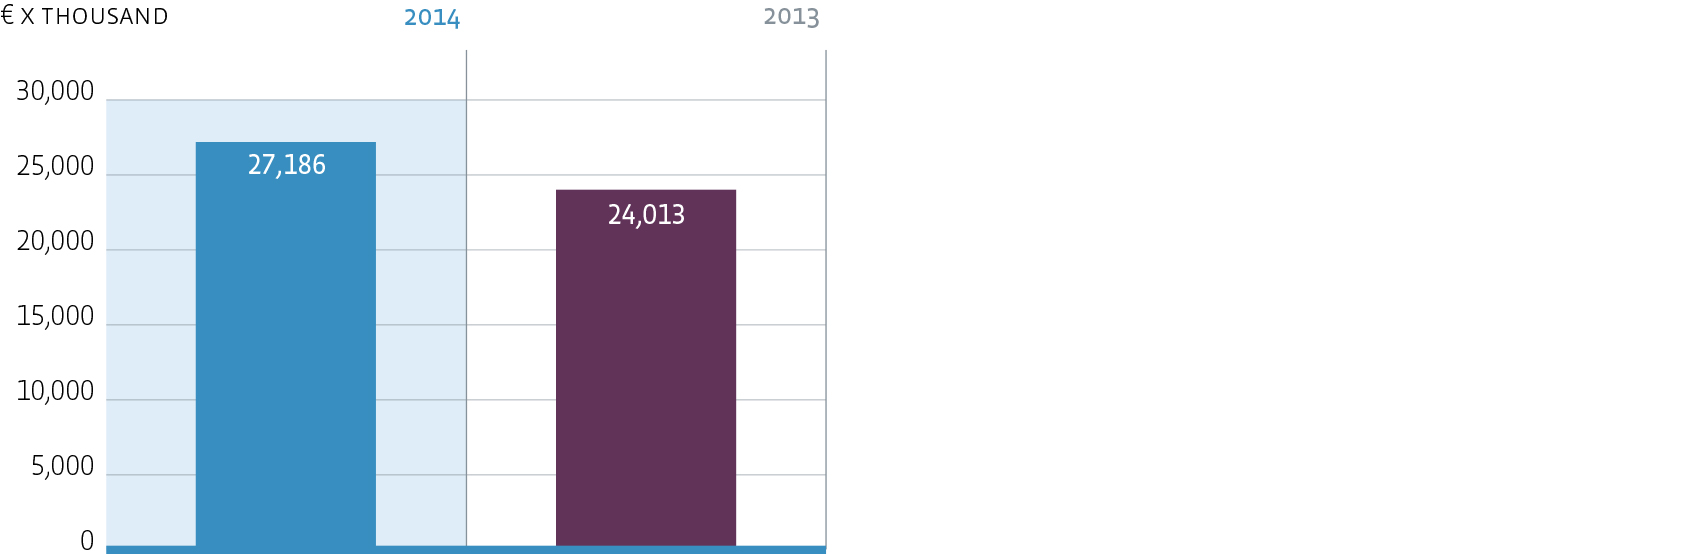
Balance sheet
| X € THOUSAND | 2014 | 2013 |
| Total assets | 30,770 | 28,980 |
| Total shareholders' equity | 27,186 | 24,013 |
| Number of shares | 225,000 | 225,000 |
Download XLSShareholders' equity
Result
| X € THOUSAND | 2014 | 2013 |
| Result after taxes | 3,173 | 4,903 |
| Result before taxes | 2,953 | 2,653 |
Download XLSResult after taxes
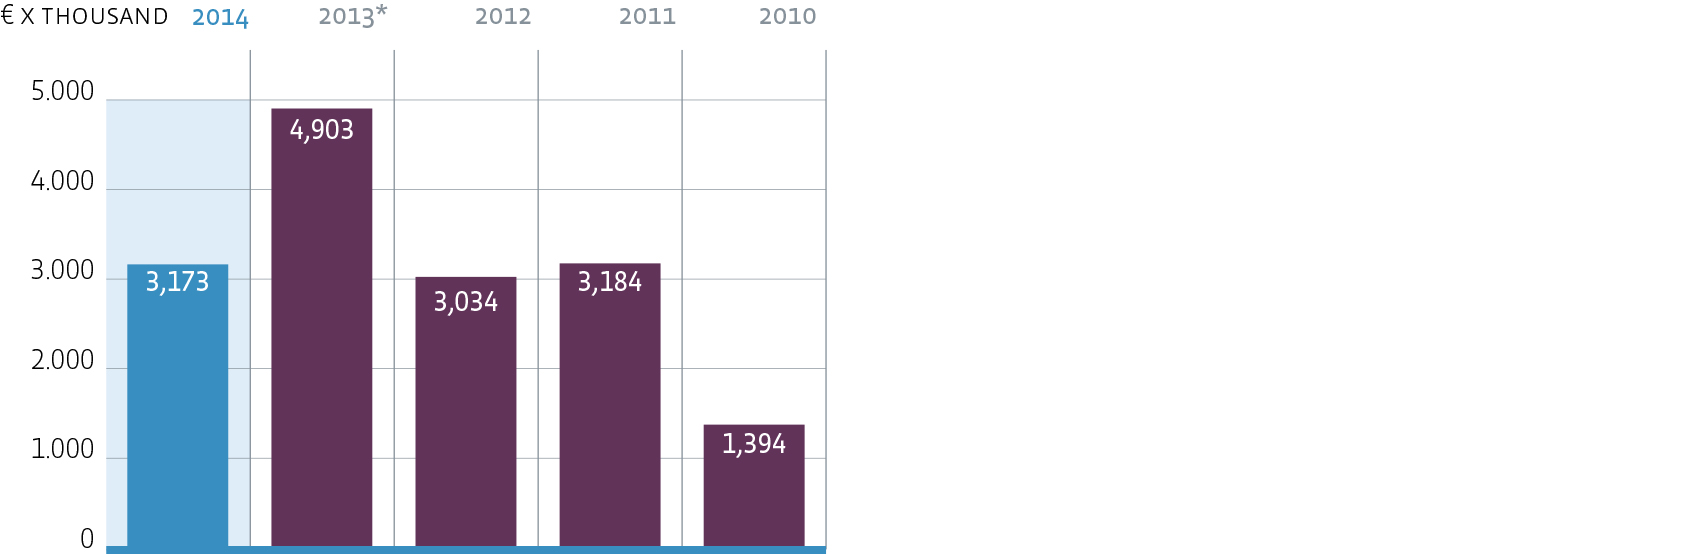
* The result after taxes of € 4.9 million in 2013 includes € 2.9 million income from tax loss carry-forward in 2013.
Figures management organisation
| X € THOUSAND | 2014 | 2013 |
| Assets under management | 6,700,206 | 6,060,282 |
| Fee income | 27,854 | 27,324 |
| Personnel costs | 17,014 | 16,815 |
| Number of employees (fte) | 128.0 | 122.6 |
| Costs per employee | 132.92 | 137.15 |
| Fee income per employee | 217.61 | 222.87 |
Download XLSAssets under management
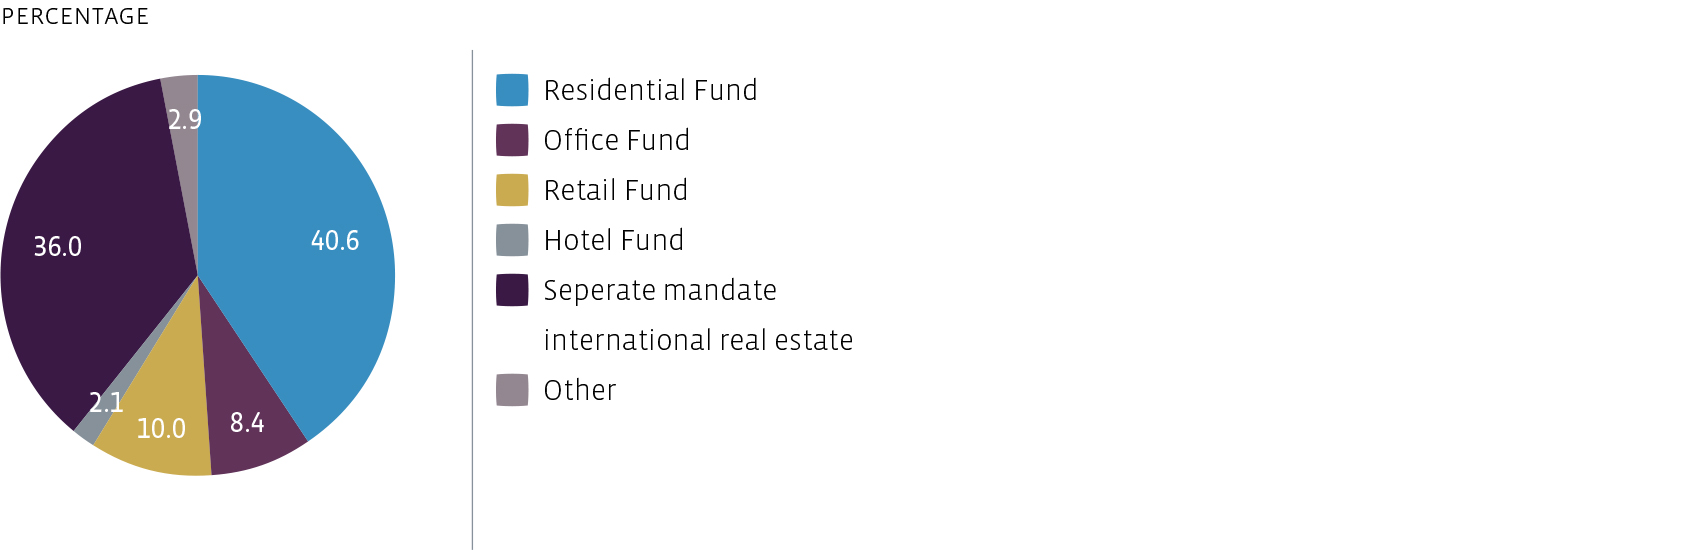
Distribution assets under management
| X € THOUSAND | 2014 | 2013 |
| Residential Fund | 2,715,283 | 2,599,612 |
| Office Fund | 565,113 | 469,201 |
| Retail Fund | 670,322 | 605,784 |
| Hotel Fund | 140,935 | 154,992 |
| Seperate mandate | | |
| International real estate | 2,412,267 | 1,947,231 |
| Other | 196,286 | 283,462 |
| | 6,700,206 | 6,060,282 |
Download XLS